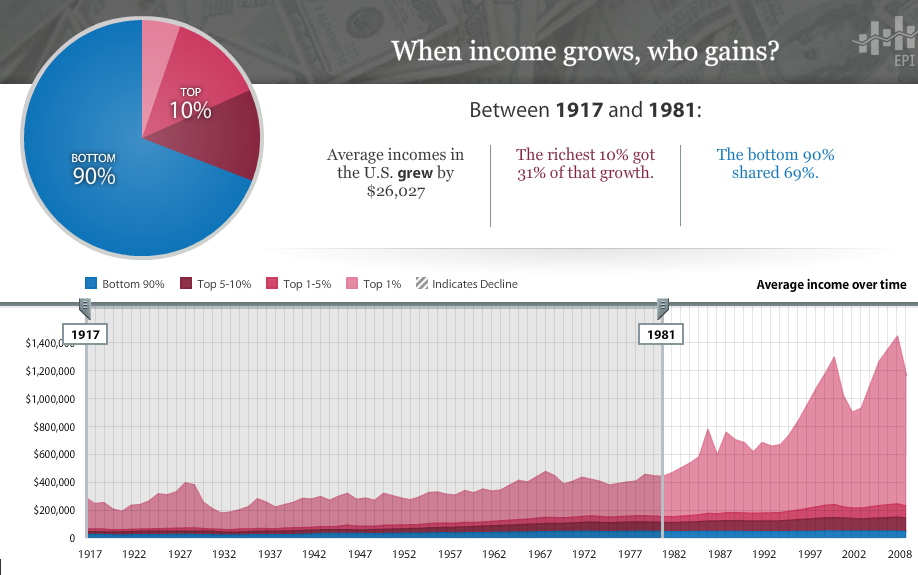
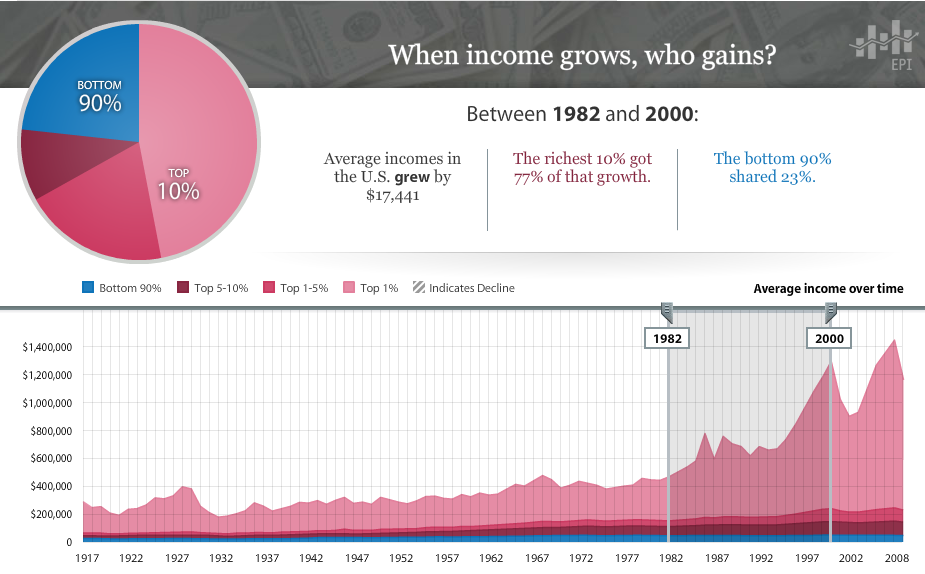
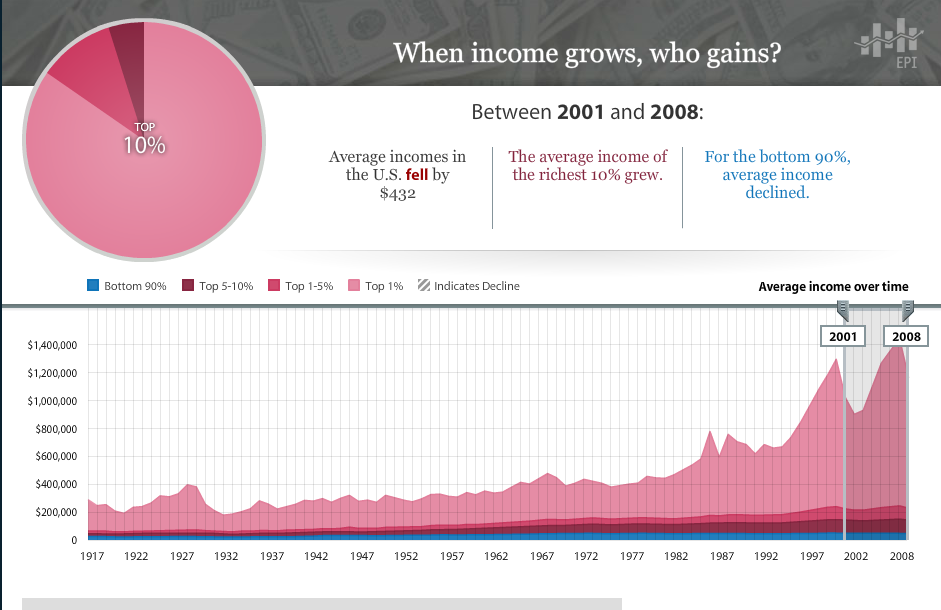
Superbe outil d'analyse de la disparité des revenus aux Etats-Unis
On comprend mieux à la lecture de ces chiffres, l'origine des mouvements Occupy Wall Street et des Indignés.
(car on pourrait sans doute faire la même analyse dans de nombreux pays...
>

>

>

Source :
http://www.stateofworkingamerica.org/pages/interactive#/

>
1917-81: Bottom 90% captured 69% of income gains

>
1982-2000: Bottom 90% captured 23% of income gains

>
2001-2008: Bottom 90% had income losses (negative gains)

http://www.stateofworkingamerica.org/pages/interactive#/
